library(tidyverse)
# 自由度
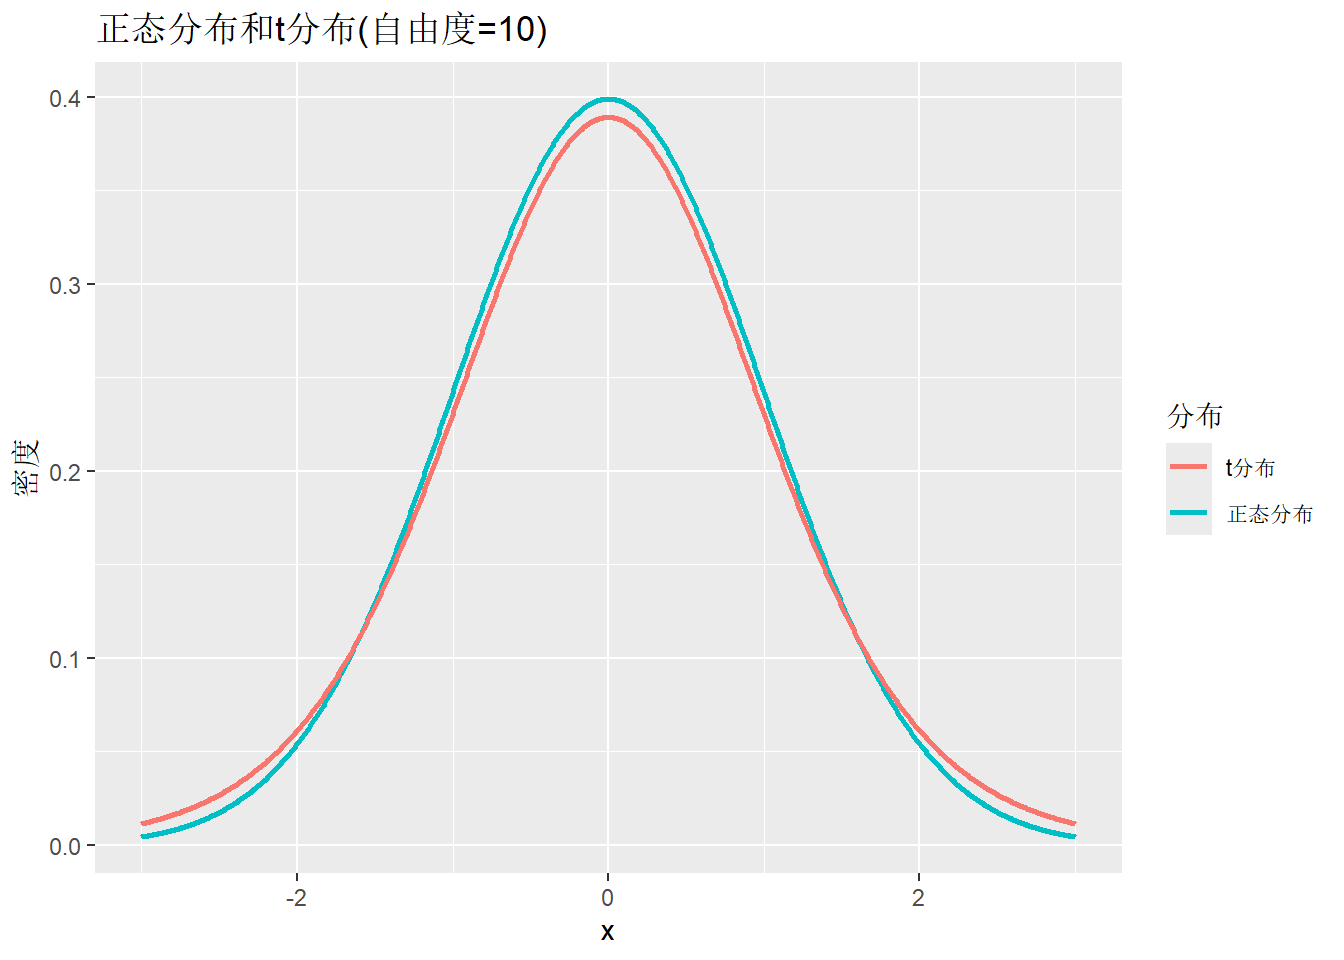
df <- 10
# 生成数据
x <- seq(-3, 3, length.out = 1000)
data <- tibble(
x = x,
normal = dnorm(x), # 正态分布密度
t_dist = dt(x, df = df)
)
ggplot(data, aes(x = x)) +
geom_line(aes(y = normal, color = "正态分布"), linewidth = 1) +
geom_line(aes(y = t_dist, color = "t分布"), linewidth = 1) +
labs(
title = "正态分布和t分布(自由度=10)",
x = "x",
y = "密度",
color = "分布"
)